
Quick start
-
Prepare the environment:
- Python 3.6.x
- Anaconda 3

-
Install libraries (if not installed):
- pandas
- scipy
- numpy
- configparser
-
Get the gfortran compiler:
GFORTRAN

-
Download SELENE to your file system:
SELENE

-
Prepare FORTRAN foreman script:
- Go to /SELENE/foreman and compile predicc.f with gfortran and options -fno-automatic, -ffixed-line-lenght-132 and -O2
- Give execution permissions to predicc.e (+755)
-
Configure SELENE:
- Edit /SELENE/configuration/config.ini to indicate where is foreman and outputs folder
- Edit /SELENE/configuration/stations.json to add stations and related parameters
-
Prepare original sea level data series:
Copy sea level time series files to data files folder (these files are configured in stations.json)
-
Run SELENE:
python selene.py [station_id]
-
Visualize results with SELENE:
python selenevis.py -station [station_id]
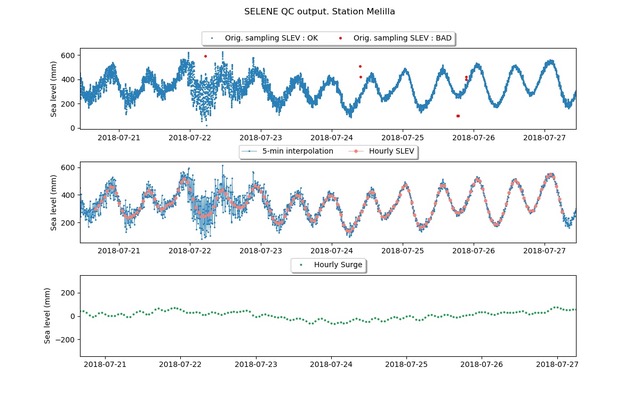
Display of the output files of SELENE software applied to Melilla Tide Gauge (REDMAR network) data in July 2018: top: original data (1-min) with QC flags (in red the bad data detected by the software); center: two by-products generated by SELENE: 5-min interpolated time series and hourly values (orange); bottom: final by-product generated if harmonic constants are available, the hourly residual for the analyzed period